Support/Resistance With Breaks & Bounces [MyTradingCoder]This script uses the built-in pivothigh/pivotlow functions to find and identify new levels of basic support and resistance. The script will also automatically identify the first occurrence of a bounce/rejection off the most recent green/red line as well as automatically identify the first occurrence of a breakout of the most recent green/red line. This is a very basic, but effective indicator that is well written, and open source for anyone to learn from or build off of.
All details needed to understand how to use the script are listed below. Enjoy!
Customizable inputs:
- Option to change how pivot points are calculated('candle body' or 'candle wicks')
- Option to change the sensitivity of the pivots(leftbars and rightbars linked)
- Option to change the line width
Available Alert Options:
- Red Line Breakout
- Red Line Bounce/Rejection
- Green Line Breakout
- Green Line Bounce/Rejection
User Manual:
- All calculations are done on the last update of the bar(candle close)
- Only 1 breakout will be allowed per line
- Only 1 rejection will be allowed per line
- If the text is red, then the signal is related to the 'red line', if the text is green, then the signal is related to the 'green line'
- The code is open source, and is programmed using arrays/loops out of the gate, despite not needing to do so. This allows for easy modifications to the scripts behavior while keeping the functionality without it breaking.
- Pivot Rightbars is hardcoded to the same value for leftbars(leftbars = sensitivity). Uncomment the input for right_bars if you want the ability to change the rightbars independently from the leftbars
- When a new line is identified, the old one will stop updating, and no longer be considered for breakout/rejections. This can be changed with a bit of pine knowledge by performing some slight modifications to the code.
- When a new line is drawn, the old line will move backwards a little bit for cleanliness/clarity purposes
- If you have any questions/comments/requests/concerns please leave them down in the comments below
- Don't forget to leave a like if you find this script useful
"support resistance" için komut dosyalarını ara

Support Resistance Major/Minor [TradingFinder] Market Structure🔵 Introduction
Support and resistance levels are key concepts in technical analysis, serving as critical points where prices pause or reverse due to the interaction of supply and demand. These foundational elements in price action and classical technical analysis assist traders in understanding market behavior and making better trading decisions.
Support levels are zones where demand is strong enough to prevent further price declines, while resistance levels act as barriers that hinder price increases.
Support and resistance levels are divided into two main types: static and dynamic. Static levels are fixed horizontal lines on charts, formed based on historical price points, and are crucial due to repeated price reactions in these areas.
Dynamic levels, on the other hand, move with market trends and are often identified using tools like moving averages and trendlines. These levels are particularly useful for analyzing dynamic trends and identifying potential reversal points in financial markets.
The importance of support and resistance in technical analysis lies in their ability to pinpoint price reversal or continuation points. Professional traders use these levels to determine optimal entry and exit points and combine them with tools such as Fibonacci retracements or moving averages for precise strategies.
Detailed analysis of price behavior at these levels provides insights into trend strength and the likelihood of price breaks or reversals. By understanding these concepts, technical analysts can forecast future price movements and optimize their trading decisions using tools such as indicators and price action. Support and resistance levels, as a cornerstone of technical analysis, form the foundation for many trading strategies.
🔵 How to Use
The Static Support and Resistance Indicator is a vital tool for identifying significant price zones in financial markets. It automatically detects major and minor support and resistance levels in both short-term and long-term intervals, enabling traders to analyze price behavior accurately and develop optimal entry and exit strategies.
🟣 Major Long-Term Support and Resistance
Major Long-Term Support : The lowest price points recorded over long-term intervals that prevent further declines.
Major Long-Term Resistance : The highest price points in long-term intervals that limit further price increases.
🟣 Minor Long-Term Support and Resistance
Minor Long-Term Support : Temporary halts in price decline within a downtrend over long-term intervals.
Minor Long-Term Resistance : Short-term zones within long-term intervals where prices react negatively in an uptrend.
🟣 Major Short-Term Support and Resistance
Major Short-Term Support : The lowest price points in short-term intervals that act as barriers against sharp price drops.
Major Short-Term Resistance : The highest points in short-term intervals that prevent further price surges.
🟣 Minor Short-Term Support and Resistance
Minor Short-Term Support : Temporary halts in price decline within short-term downtrends.
Minor Short-Term Resistance : Zones where price reacts quickly and reverses in short-term uptrends.
🔵 Settings
Long Term S&R Pivot Period : Defines the interval for identifying long-term support and resistance levels (default: 21).
Short Term S&R Pivot Period : Defines the interval for identifying short-term support and resistance levels (default: 5).
🟣 Long-Term Lines
Major Line Display : Enable/disable major long-term lines.
Minor Line Display : Enable/disable minor long-term lines.
Major Line Colors : Green for support, red for resistance (long-term major levels).
Minor Line Colors : Light green for support, light red for resistance (long-term minor levels).
Major Line Style : Choose between solid, dotted, or dashed lines for major long-term levels.
Minor Line Style : Choose between solid, dotted, or dashed lines for minor long-term levels.
Major Line Width : Adjust the thickness of major long-term lines.
Minor Line Width : Adjust the thickness of minor long-term lines.
🟣 Short-Term Lines
Major Line Display : Enable/disable major short-term lines.
Minor Line Display : Enable/disable minor short-term lines.
Major Line Colors : Gray-green for support, gray-red for resistance (short-term major levels).
Minor Line Colors : Dark green for support, dark red for resistance (short-term minor levels).
Major Line Style : Choose between solid, dotted, or dashed lines for major short-term levels.
Minor Line Style : Choose between solid, dotted, or dashed lines for minor short-term levels.
Major Line Width : Adjust the thickness of major short-term lines.
Minor Line Width : Adjust the thickness of minor short-term lines.
🔵 Conclusion
Static support and resistance levels are among the most critical tools in technical analysis, helping traders identify key reversal or continuation points.
This indicator simplifies and enhances the analysis process by automatically detecting major and minor levels in both short-term and long-term intervals. It allows traders to customize settings to suit their trading strategies and analyze different market levels effectively.
Using this indicator improves price action analysis, enhances market understanding, and identifies trading opportunities. Applicable to all trading styles, from day trading to long-term investing, it is an essential tool for technical analysis.
Combining this indicator with other tools like trendlines, Fibonacci retracements, and moving averages enables comprehensive analysis and allows traders to navigate financial markets with greater confidence.

[UST] Protein+Support/Resistance Script: A Comprehensive Overview
Thanks to Pmgjiv for providing the foundation to this improved Version.
In the world of trading, having a robust support and resistance analysis tool can make a significant difference in decision-making and overall strategy. Let's delve into the enhancements made to the support/resistance script and how each component contributes to a trader's arsenal:
Changes and improvements made for the script to help Traders make better rational decisions in their Trading:
1. Multiple Timeframes:
Integrating multiple timeframes into the analysis provides a multi-dimensional view of the market. Traders can now assess price action across different time horizons simultaneously. This feature allows for a deeper understanding of market dynamics and helps in identifying significant support and resistance levels across various timeframes.
2. Timeframe Labels Inside Zones:
By including timeframe labels within the zones, traders can easily identify the origin of each support or resistance level. This contextual information enhances clarity and facilitates more informed decision-making, especially when navigating through multiple timeframes.
3. Visual Zone Update:
Visual updates on zones enable traders to track changes in support and resistance levels in real-time. This dynamic feature enhances the analytical process by providing immediate insights into evolving market conditions, thereby enabling traders to adapt their strategies accordingly.
4. Zones Hit:
Understanding the frequency and intensity of zone hits offers valuable insights into the strength and relevance of support and resistance levels. Traders can gauge the significance of each zone based on its historical interaction with price, thereby gaining a deeper understanding of market sentiment and potential trading opportunities.
5. Option to Turn off Current Timeframe:
The ability to toggle off the current timeframe streamlines chart analysis by focusing only on the most critical support and resistance zones. This decluttering feature helps traders prioritize key levels, reducing cognitive overload and enhancing decision-making efficiency.
Explanation of Additional Functions:
a. Lookback:
The 'lookback' parameter allows traders to customize the age of support and resistance zones based on their trading style and preferences. By adjusting the lookback setting, traders can choose whether to prioritize recent price action or consider historical data, thus tailoring the analysis to their specific trading strategies.
b. Swinglength:
Swinglength determines the sensitivity of the support and resistance zones. By modifying this parameter, traders can control how aggressively the script identifies pivot points. A higher swinglength value results in smoother, more stable zones, whereas a lower value increases sensitivity, capturing smaller price movements.
c. ZigZag Indicator:
The ZigZag indicator plays a pivotal role in identifying significant price reversals. Its period setting determines the number of price bars considered before confirming a pivot point. Traders can utilize this indicator to identify key turning points in the market, aiding in the identification of robust support and resistance levels.
Impact of Sensitivity on Zones:
Adjusting the sensitivity of the ZigZag indicator directly influences the identification and delineation of support and resistance zones. Higher sensitivity levels result in fewer but more robust zones, capturing significant price movements. Conversely, lower sensitivity levels yield more zones, accommodating smaller price fluctuations but potentially introducing noise into the analysis.
d. S/R Range:
The ability to adjust the width of support and resistance zones allows traders to customize the breadth of key areas on a chart. Choosing a wider range encompasses a broader spectrum of prices, thereby identifying more comprehensive support and resistance levels. This flexibility enables traders to adapt their analysis to different market conditions and trading strategies.
Utilization in Trading:
Comprehensive Analysis: By incorporating multiple timeframes, traders gain a holistic view of market dynamics, enabling them to identify high-probability trading opportunities across various horizons.
Contextual Understanding: Timeframe labels within zones provide context, helping traders understand the significance of each level in relation to different timeframes and market conditions.
Real-time Adaptability: Visual zone updates facilitate real-time analysis, allowing traders to adjust their strategies promptly in response to changing market conditions.
Informed Decision-making: By considering zone hits, traders can assess the strength and relevance of support and resistance levels, enhancing their ability to make informed trading decisions.
Customized Analysis: Adjustable parameters such as lookback, swinglength, and sensitivity empower traders to tailor the analysis to their individual trading styles and preferences, enhancing precision and effectiveness.
In summary, these enhancements to the support/resistance script provide traders with a powerful toolkit for analyzing market dynamics, identifying key levels, and executing well-informed trading strategies across various timeframes and market conditions.

Support Resistance by EVThis indicator is designed to provide a clean and practical market structure view by combining automatic support and resistance detection with dynamic trend analysis. It identifies key support and resistance levels using confirmed swing highs and lows, intelligently merging nearby levels based on market volatility and filtering out outdated or irrelevant zones to keep the chart clear and focused on what matters now.
In addition to horizontal support and resistance, the indicator offers two complementary ways to read trend context. It can display diagonal trendlines built from the most recent swing highs and swing lows to visualize directional structure, or horizontal trend rays based on the latest pivots to highlight dynamic support and resistance acting as trend references. The user can switch between these modes depending on trading style and market conditions.
All visual elements are anchored by time rather than bar index to ensure stability when zooming or scrolling the chart. The indicator is fully non-repainting, relies only on confirmed pivots, and is suitable for any market or timeframe. It is intended as an open-source, professional-grade tool that helps traders quickly identify structure, trend bias, and key reaction levels without clutter or visual noise.

Support Resistance - Percentile LevelsKey Features:
1. Percentile Calculations:
The indicator calculates the 95th percentile (PercentilePlot100) and the 5th percentile (PercentilePlot5) of the high and low prices over specified lengths.
The lengths for these calculations are adjustable via input fields, allowing users to customize the periods used for percentile calculations.
2. Percentile Levels:
Resistance Levels (R1, R2, R3, R4): Plots resistance levels based on the 95th percentile of the high prices over different lengths (100, 200, 750, 4500).
Support Levels (S1, S2, S3, S4): Plots support levels based on the 5th percentile of the low prices over different lengths (100, 200, 750, 4500).
3. High-Timeframe Average:
Calculates and plots the average of the 750-period high and low percentiles (htfavg), which acts as a pivot point on the chart.
How to Use This Indicator:
1. Identify Key Support and Resistance Levels:
Use the plotted resistance (R1, R2, R3, R4) and support (S1, S2, S3, S4) levels to identify key areas where price may reverse or consolidate.
2. Pivot Point Analysis:
The plotted pivot point (htfavg) can be used to identify potential areas of trend change or consolidation. It represents the average price level based on higher timeframe percentiles.
3. Trend Analysis:
By observing how price interacts with these percentile levels, traders can gain insights into market trends and potential reversal points.
Customization:
The input fields allow you to customize the lengths of the percentiles and the percentile plot values according to your trading strategy and timeframe preference.
In summary, this indicator can help traders identify significant support and resistance levels, potential pivot points, and overall market trends based on percentile calculations of high and low prices over various periods. This can be valuable for making informed trading decisions and setting entry and exit points.
If you have any specific questions or need further customization, feel free to ask! 😊

Support Resistance base Volume RSIThe indicator displays support and resistance levels based on volume and the Relative Strength Index (RSI).
Variable and Input Assignment:
lookback: Determines the period for data lookback.
RsiVisible, RsilabelSize, OversoldForRsi, OverboughtForRsi: Various inputs to adjust RSI indicator parameters.
Indicator Calculation:
highestVol: Finds the highest volume within a certain period.
Rsi: Calculates the RSI value with a period of 14.
roc: Calculates the Rate of Change.
Support and Resistance Level Determination:
Uses a comparison between price change (roc) and RSI value to determine whether the price is rising or falling.
If the price is rising and the current volume is greater than the previous highest volume, a new resistance level is established.
If the price is falling and the current volume is greater than the previous highest volume, a new support level is established.
Support and Resistance Lines:
Creates lines indicating the latest support and resistance levels.
These lines are updated whenever there is a change in support or resistance levels.
RSI Labels:
Displays the RSI value above or below the price chart depending on whether the RSI is above or below the overbought or oversold levels.
If the RSI value is above the overbought level, the label is displayed above the price.
If the RSI value is below the oversold level, the label is displayed below the price.
Labels are removed if the corresponding conditions are not met.
Additional RSI Label:
Adds an additional label displaying the RSI value next to the price chart on the last bar.
The main purpose of this script is to assist traders in identifying support and resistance levels based on price movement, volume, and the RSI indicator. Thus, traders can use this information to make better trading decisions.

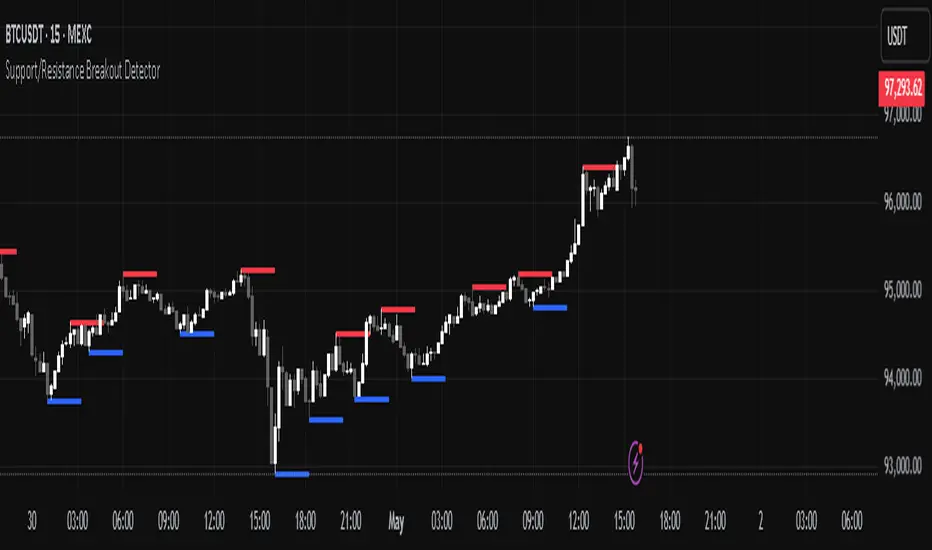
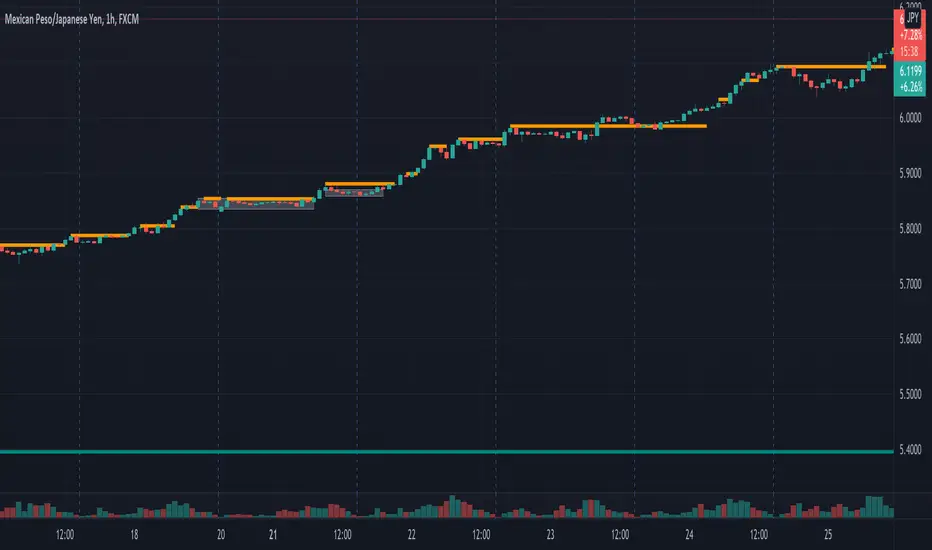
Support/Resistance Breakout DetectorThis indicator automatically detects and plots dynamic support and resistance levels using pivot highs and lows.
✅ It draws red resistance lines and blue support lines,
✅ The lines extend forward but automatically stop when the price touches them,
✅ It monitors for breakouts with strong volume,
✅ When a breakout happens, it shows labels like “B” or “Bull Wick” / “Bear Wick” on the chart,
✅ It also triggers alerts when support or resistance breaks with high volume.
Main settings:
Pivot lookback period
Show/hide breakout labels
Minimum volume for breakout
Maximum extension length for lines
This tool helps traders easily spot key price levels and watch for meaningful breakouts.
Support/Resistance LinesThis script displays support and resistance lines at the levels you enter in the Input Settings. It does not perform the S/R calculations.
It allows you to:
Enter up to 6 support and 6 resistance lines each; any with value of 0 will be hidden
Specify one ticker that it applies to, so the lines will be hidden if you switch charts
Set the text size, color, horizontal offset, and whether to display the price values for each line
Set the color, transparency and line type for the S/R lines

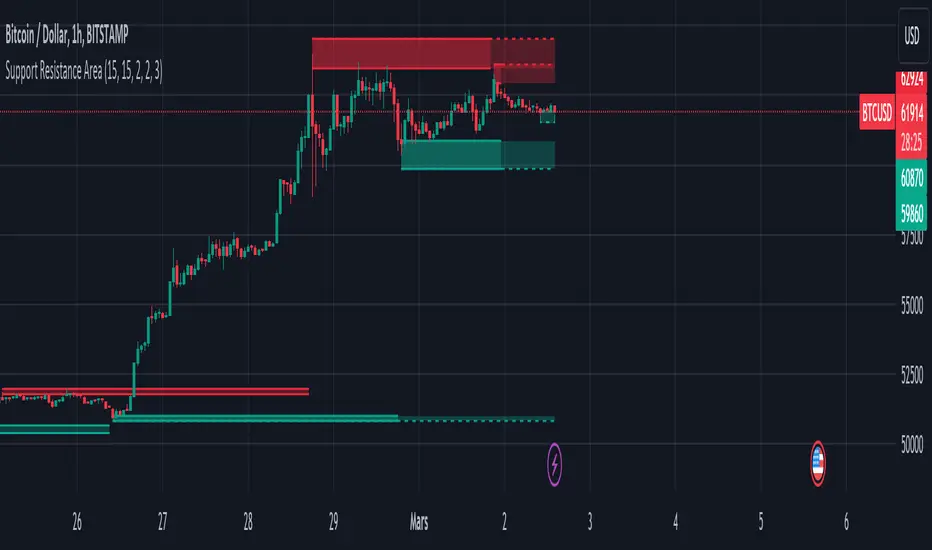
Support Resistance ZonesSupport and resistance zones are used across all markets by traders and bots alike to identify liquidity and possible bounce areas. This script automates the drawing of those zones based on a number of variables, such as lookback period, channel width, number of touch confirmations and more.
This script also implements a some useful alerts so you can rest easy until the market hits a point of interest:
Enter SR Zone
Exit SR Zone
Break Upper Resistance
Break Lower Resistance

Support, Resistance, MA, and ADXSummary
This comprehensive script provides traders with a tool that highlights critical levels of support and resistance, detects significant price breakouts with volume confirmation, identifies potential reversals with wick analysis, and plots a moving average that changes color based on trend strength as indicated by the ADX. It is useful for spotting entry and exit points, confirming breakouts, and identifying trend direction and strength.

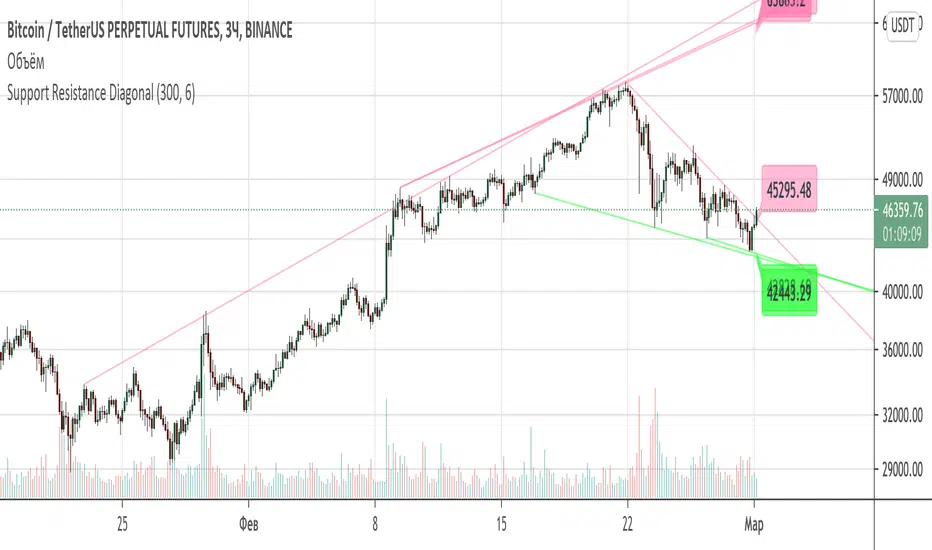
Support Resistance DiagonalClassic diagonal support and resistance based on pivot points. As a result, they form triangles, wedges, channels and other patterns. Realtime update up to 1 second chart.
Support/Resistance x3Support and Resistance Levels for 3 time frames, based on volume at fractal levels
Original script is thanks to synapticex I have just migrated to version 3 and heavily modified it

Support/Resistance V2 IndicatorWith this support and resistance indicator, if you want more levels just change the timeframe it looks at in the settings. It will pull the SR levels off the timeframe specified in the settings. Note: SR1 and SR2 timeframe should match.
Support Resistance SD Levels Intraday OnlyYour script calculates the highest upper Bollinger Band and lowest lower Bollinger Band reached during a session. It then projects those values into the next session as horizontal levels (Previous Day High/Low based on SD). This is a solid way to identify "overextension" zones where the market historically reversed or stalled.

Support Resistance - Aging [Example]Hello All,
First all of Thanks to Pine Team for adding Arrays to Pine!
In this script I tried to make example for
1. Finding S/R lines using highest/lowest function
2. Using 1D array as 2D (we keep S/R levels and age)
3. "Age" usage for S/R levels, getting older on each candle and changing colors by their age (maximum age is 127 then it disappears)
You can use "Close"/Open " or " High/Low " as source.
There is an option for the background color, by default it's Black, do not forget to set it accordingly :)
Enjoy!


Standard Deviation Pivot pointsSupport Resistance points that are calculated based on the standard deviation of the traditional pivot point(previous session's high, low and close). More often stocks tend to oscillate between 3 levels of deviation forming day's high or low. A breakout of the 3rd SR level with volume indicates a strong trend day.

TLADe GEX Dashboard - ES/SPX/SPY Gamma Exposure LevelsA professional framework for Gamma Exposure analysis on S&P 500 instruments.
━━━━━━━━━━━━━━━━━━━━━━━━━━━━
WHAT THIS INDICATOR DOES
This indicator visualizes key strategic levels derived from Gamma Exposure (GEX) analysis — the zones where dealer hedging flows create measurable support and resistance.
What you see:
- Call Walls — resistance zones where dealers hedge against upside
- Put Walls — support zones where dealers hedge against downside
- Zero Gamma — the structural pivot between mean-reversion and trend
- Expected Move bands — statistical range boundaries
- GEX Histogram — gamma distribution profile directly on chart
━━━━━━━━━━━━━━━━━━━━━━━━━━━━
KEY FEATURES
▸ Ticker Switcher
Select ES, SPX, or SPY directly in settings.
Data converts automatically. One script, three instruments.
▸ GEX Profile Histogram
See gamma distribution as horizontal bars on your chart.
Instantly spot where positioning clusters.
▸ Color Themes
Choose between Boreal, Classic, or Lady Trader palettes.
▸ Level Toggles
Show/hide level groups independently:
GEX Levels | System Levels | Structure Levels
▸ Rich Tooltips
Hover for details: GEX values, Call/Put ratio, Hold/Break probabilities.
▸ Flip Detection
When price crosses a level, it automatically updates role and style (solid → dashed).
━━━━━━━━━━━━━━━━━━━━━━━━━━━━
HOW TO READ THE LEVELS
Each line represents a zone where price reaction is statistically probable:
- Thick solid lines = level not yet crossed
- Dashed lines = level flipped (price crossed through)
- Cyan/Teal or Green = potential support (Put Walls)
- Pink/Red = potential resistance (Call Walls)
- Gray = structural levels (Zero Gamma, Vol Bands, PDH/PDL)
The indicator shows structure, not predictions.
Use it to identify where the market is likely to react — not which direction it will go.
━━━━━━━━━━━━━━━━━━━━━━━━━━━━
PRO TIP: CONFLUENCE
This tool is most powerful when combined with your own analysis.
Highest-probability setups occur when GEX levels align with:
Price action zones (support/resistance, order blocks)
Volume Profile (HVN/LVN, VWAP)
Technical structure (prior highs/lows, trend lines)
One level alone is information. Confluence is edge.
━━━━━━━━━━━━━━━━━━━━━━━━━━━━
ABOUT THE DATA
The levels shown use a static snapshot for demonstration.
For current session data, export fresh scripts from the TLADe terminal at tradelikeadealer.com
━━━━━━━━━━━━━━━━━━━━━━━━━━━━
DISCLAIMER
This tool is for informational and educational purposes only.
It does not constitute financial advice. Trading involves significant risk.
Past structure does not guarantee future behavior.

Support and Resistance ZoneSupport and Resistance Zone Indicator :
Introduction :
The purpose of this indicator is to identify the chart symbol's main supports and resistances. It displays these key zones, which are very important psychological points for traders. Since support and resistance are not very precise levels, the indicator displays them as zones.
Pivots :
Pivots are a key concept in identifying support and resistance. The indicator uses two types of pivot:
Pivot high : This is a high point that has not been reached by a user-defined number of candles on either the left and right of this candle. The " left pivot leg " is the number of candles before this pivot point that have not reached the realized high, and the " right pivot leg " is the number of candles after this pivot point that have not reached this high. If these two conditions are met, the pivot point is considered a turning point, and resistance is probably the cause.
Pivot low : This is a low point that has not been reached by a user-defined number of candles on either the left or right. The " left pivot leg " is the number of candles before this pivot point that have not reached the candle low, and the " right pivot leg " is the number of candles after this pivot point that have not reached this low. If these two conditions are met, the pivot point is considered a turning point, and support is probably the cause.
Support/Resistance area :
If a pivot point has been identified, the indicator considers it a resistance if it's a pivot high, or a support if it's a pivot low. To define the support or resistance zone, we'll use the ATR (Average True Range), an indicator that measures asset volatility. We'll take the ATR of the candle for which the pivot was spotted, and use it as the width of the support or resistance zone. Thus the upper line of support/resistance is at pivot+atr/2 and the lower line is at pivot-atr/2 . The greater the volatility, the larger the zone.
New Support/Resistance :
If a new pivot has been identified, but the level of this pivot lies between the lower line and the upper line of the previous support or resistance, the indicator considers this to be the same support or resistance as before. In this case, no new support or resistance is created. The pivot must be outside the area of the previous support or resistance to be validated.
Anticipated Support/Resistance :
This indicator also allows early detection of support or resistance. To do this, the value of the right pivot legs will be shortened in order to find these areas more quickly. The support or resistance will then be considered anticipated and may disappear at any time if the high/low is reached. On the other hand, if the high/low is not reached, and a number of candles equal to the " Right Pivot Legs" parameter has elapsed since the detection of this anticipated support/resistance, it will be considered validated and will integrate the other supports/resistances of the chart.
Extended supports/resistances :
For a more optimal view, the indicator allows the user to choose the number of last support or resistance levels to be extended to the last candle. This must be specified in the indicator parameters.
Parameters :
Pivot Legs : Determine the left and right legs of the pivot i.e the number of candle before and after the pivot that doesn’t reach pivot point. The pivot is validated only if this two conditions are verified.
Extend Last Supports : Number of supports to extend to the last bar
Extend Last Resistances : Number of resistances to extend to the last bar
Show Support/Resistance Anticipated : If yes, will find anticipated support and resistance
Right Pivot Legs for Anticipation : Determine the right legs of pivots to find faster a support or a resistance.
Conclusion :
This indicator plot support and resistance zones based on pivot. The width of support and resistance zones are calculated with ATR. Possibility to find anticipated support and resistance in order to have more timeliness informations.
Enjoy the indicator and don’t forget to take the trade ;)
srd786-Intraday VWAP Price Action IndicatorDISCLAIMER
This Pine Script indicator does not constitute financial advice; it is just intended for educational and informational purposes. It functions as a tool for technical analysis that could help traders spot possible trading opportunities. It is crucial to remember that participating in financial markets has a number of risks that might result in large losses and are not suitable for all investors.
Users are encouraged to conduct their own thorough investigation and analysis prior to using this indicator. Avoiding trading with money that one cannot afford to lose is essential. It is also advised to seek advice from a certified financial expert. Users must use suitable risk management techniques and recognize that past success does not guarantee future outcomes.
Any losses, damages, or other consequences resulting from the usage of this indicator are not the author's responsibility. The user is ultimately responsible for all trading decisions, therefore using this tool is at their own risk.
INTRODUCTION
The “srd786-Intraday VWAP Price Action Indicator” is a sophisticated Pine Script (version 6) trading tool designed for intraday traders who focus on New York session trading hours. This indicator combines multiple technical analysis concepts including Volume Weighted Average Price (VWAP), Average True Range (ATR) for risk management, swing point detection for support/resistance identification, and momentum analysis through RSI. The primary objective is to generate high-probability long and short signals based on price action confluence with trend, momentum, and key structural levels.
1.
VWAP (Volume Weighted Average Price): Shows the "fair" average price based on both price and trading volume.
2.
ATR (Average True Range): Measures how much the price typically moves each day.
3.
Trend Analysis: Identifies whether the market is going up, down, or sideways.
4.
Momentum Indicators: Shows how strong the current price movement is.
5.
Support & Resistance: Identifies key price levels where the price might stop or reverse.
6.
Swing Points: Finds significant turning points in the price.
This indicator is specifically optimized for the New York trading session (9:30 AM to 4:00 PM ET), making it particularly suitable for traders who focus on US market hours. It provides a complete trading framework that includes not only signal generation but also precise trade management levels including entry prices, stop-loss orders, and profit targets based on a configurable reward-to-risk ratio.
The philosophy behind this indicator is confluence-based trading. Rather than relying on a single indicator or condition, it requires multiple factors to align before generating a trade signal. This approach filters out lower-probability setups and focuses only on high-quality opportunities where price action, trend direction, momentum, and key technical levels all point in the same direction.
CORE CONCEPT AND METHODOLOGY
Volume Weighted Average Price (VWAP)
VWAP is the cornerstone of this indicator's trading methodology. Unlike a simple moving average that treats all price bars equally, VWAP incorporates volume data into its calculation, giving more weight to bars with higher trading volume. This makes VWAP a more accurate representation of the true average price where the most significant trading activity occurred.
The calculation of VWAP is performed using the built-in 'ta.vwap()' function, which computes the cumulative volume-weighted average price from the beginning of the session. For intraday traders, VWAP serves as a critical reference point that indicates whether the current price is trading at a premium (above VWAP) or discount (below VWAP) relative to the session's volume-weighted average.
In this indicator, the VWAP source is configurable through the 'vwapSource' parameter, with the default being HLC3 (High + Low + Close / 3). This source selection allows traders to experiment with different price types such as typical price, weighted close, or even custom sources to suit their trading style and market preferences.
Average True Range (ATR) for Risk Management
The Average True Range, calculated using 'ta.atr()', measures market volatility by decomposing the current range of price movement. ATR does not indicate price direction;
instead, it quantifies the degree of price movement or volatility over a specified period. In this indicator, ATR serves dual purposes: determining the distance for limit orders and calculating stop-loss levels.
The 'atrLength' parameter (default: 14) controls the lookback period for the ATR calculation. A shorter length makes the indicator more responsive to recent volatility, while a longer length provides a smoother average that may be more suitable for less volatile markets. The 'atrMultiplier' (default: 1.5) determines how many ATR units away the stop-loss is placed from the entry price, allowing traders to adjust their risk exposure based on current market conditions.
Swing Detection and Support/Resistance
Swing points represent significant turning points in price action where the market has temporarily exhausted its directional momentum. This indicator uses pivot high and pivot low calculations to identify swing highs and swing lows, which then form the basis for dynamic support and resistance levels.
The 'swingLength' parameter (default: 5) defines how many bars to the left and right of a potential pivot point must be lower (for pivot highs) or higher (for pivot lows) to confirm the swing point. This lookback period helps filter out minor price fluctuations and focuses on more significant structural levels.
Support and resistance levels are stored in arrays ('swingHighArray' and 'SwingLowArray'), with the most recent swing points serving as the primary reference levels. The 'srLookback' parameter (default: 20) controls the overall lookback window and also determines how many
swing points to maintain in each array, ensuring that only relevant historical levels are considered.
Breakout Detection
When a price moves past a major support or resistance level, this is known as a price breakout. This price breakout suggests that there is a possibility of a new trend direction heading forward.Breakout detection eliminates noise, as little price fluctuations or volatility may momentarily drive prices past a threshold without authentic conviction.Detection of breakouts affirms robustness when the price above the threshold by 2%, indicating genuine market interest, and mitigates whipsaws to prevent placing trades based on transient price swings.
The Breakout Tolerance parameter, set by default to 2%, regulates the breakout tolerance for the indicator. A price closure above the current high plus a minor tolerance buffer (usually 2%) indicates a potential continuation of upward movement, classified as a Bullish Breakout. Conversely, when the price closes below the recent low plus a minor tolerance buffer (usually 2%), it suggests that the price may continue to decline, which is classified as a Bearish Breakout Down.
Trend Identification
Trend determination is accomplished through an Exponential Moving Average (EMA) with a configurable length ('trendMaLength', default: 9). The indicator classifies trend into three
states: BULLISH (price above EMA with confirmation from the previous bar), BEARISH (price below EMA with confirmation), and SIDEWAYS (price crossing or near the EMA).
The EMA is chosen over simple moving averages because it responds more quickly to recent price changes while still providing enough smoothing to filter out noise. The confirmation requirement (both current and previous bar must be on the same side of the EMA) reduces false signals during periods of choppy price action.
Momentum Analysis
Momentum is measured using the Relative Strength Index (RSI) with a configurable length ('momentumLength', default: 9). RSI values are categorized into five states to provide nuanced momentum readings: STRONG BULL (RSI above 70), BUILDING (RSI between 55 and 70), NEUTRAL (RSI between 45 and 55), WEAKENING (RSI below 45), and STRONG BEAR (RSI below 30).
This momentum categorization allows traders to distinguish between strong trending conditions (STRONG BULL/BEAR) and transitions (BUILDING/WEAKENING), providing context for trade signals and helping to avoid entering positions during momentum divergences.
CONFIGURATION PARAMETERS
VWAP Settings
The 'vwapSource' parameter determines which price value is used in the VWAP calculation. The default value of 'hlc3' (High + Low + Close / 3) provides a balanced representation of each bar's price action. Traders can modify this to use typical price ('high + low + close / 3'), weighted close ('high + low + close + close / 4'), or other price types depending on their analytical preferences.
ATR Settings
The 'atrLength' parameter sets the lookback period for the Average True Range calculation. The default of 14 periods is standard across most trading platforms and timeframes, providing a good balance between responsiveness and smoothness. The 'atrMultiplier' parameter (default: 1.5) scales the ATR value to determine stop-loss distances. A multiplier of 1.5 means the stop-loss is placed 1.5 ATR units away from the entry price, providing enough buffer to accommodate normal volatility while limiting risk.
Trade Settings
The 'rrRatio' parameter (default: 3.0) establishes the reward-to-risk ratio for trade targets. A ratio of 2.0 means the profit target is twice the distance of the stop-loss from the entry price. The 'limitOrderDistance' parameter (default: 0.5) determines how far below (for long trades)
or above (for short trades) the current close the limit order is placed, measured in ATR units. This allows traders to enter positions at better prices while waiting for pullbacks.
Swing Detection Settings
The 'swingLength' parameter (default: 5) controls pivot identification sensitivity. Higher values identify more significant swing points but may miss shorter-term opportunities. The 'showSwings' boolean parameter toggles the visual display of swing high and low points on the chart.
Support & Resistance Settings
The 'srLookback' parameter (default: 20) defines how many bars back to search for swing points and support/resistance levels. The 'breakoutTolerance' parameter (default: 0.02 or 2%) adds a small buffer to breakout detection to account for minor penetration of support/resistance levels due to price spikes or slippage.
Trend & Momentum Settings
The 'trendMaLength' parameter (default: 9) sets the EMA length for trend determination, while 'momentumLength' (default: 9) sets the RSI lookback period. Both should be at least 5 periods for meaningful calculations.
Table Settings
The 'showTable' parameter (default: true) enables the display of two information tables that provide real-time data on Indicator values and trade levels.
SIGNAL GENERATION LOGIC
Long Signal Conditions
A long signal is generated when all the following conditions are simultaneously true:
1.
Session Filter: The trade must occur during New York session hours (9:30 AM - 4:00 PM ET).
2.
Trend Confirmation: The trend must be BULLISH (price above EMA with confirmation).
3.
Price Position: Current price must be above VWAP, indicating bullish price action.
4.
Breakout or No Resistance: Either price is breaking out above resistance level with tolerance, or there is no prior resistance level to overcome.
5.
Momentum Alignment: Momentum must be either STRONG BULL or BUILDING.
This confluence of conditions ensures that long trades are only taken when the market is trending higher, price is confirming strength by trading above VWAP, and momentum is supportive of continued upward movement.
Short Signal Conditions
A short signal is generated when all the following conditions are simultaneously true:
1.
Session Filter: The trade must occur during New York session hours
2.
Trend Confirmation: The trend must be BEARISH (price below EMA with confirmation)
3.
Price Position: Current price must be below VWAP, indicating bearish price action
4.
Breakout or No Support: Either price is breaking down below support level with tolerance, or there is no prior support level to overcome
5.
Momentum Alignment: Momentum must be either STRONG BEAR or WEAKENING
Similar to long signals, short trades require alignment across multiple timeframes and analytical approaches, filtering out counter-trend trades and focusing on high-probability setups.
TRADE MANAGEMENT FRAMEWORK
Entry Price Calculation
For long trades, the limit order price is calculated as: 'Close - (ATR Value × Limit Order Distance)'. This places the entry price below the current close, allowing traders to buy on dips while maintaining a favorable entry price. For short trades, the limit order is placed above the current close: 'Close + (ATR Value × Limit Order Distance)'.
The limit order distance is expressed in ATR units, making it adaptive to current volatility conditions. In more volatile markets, the limit order will be placed further from the current price, while in calmer markets, it will be closer.
Stop-Loss Placement
Stop-loss levels are calculated using the ATR multiplier to ensure adaptive risk management. For long trades: 'Entry Price - (ATR Value × ATR Multiplier)'. For short trades: 'Entry Price + (ATR Value × ATR Multiplier)'.
This adaptive approach to stop-loss placement means that in volatile markets, stops are wider to avoid being stopped out by normal price fluctuations, while in quieter markets, stops are tighter to limit potential losses. The default multiplier of 1.5 provides approximately 1.5 times the average true range of protection.
Target Price Calculation
Profit targets are determined by the reward-to-risk ratio: 'Entry Price + (ATR Stop Distance × RR Ratio)' for long trades and 'Entry Price - (ATR Stop Distance × RR Ratio)' for short trades. The default ratio of 2.0 means the target is twice the distance of the stop-loss, providing a favorable risk-reward profile.
New York Session Tracking
The indicator includes specialized logic for tracking the New York session open price. When a new NY session begins (determined by the 'isNewNySession' variable), the current open price is recorded and maintained throughout the session. This provides a reference point for measuring intraday directional bias from the session's starting level.
INFORMATION TABLES
Indicators Table
This table displays the current price, VWAP value, NY session open price, support level,resistance level, ATR, ATR-scaled stop distance, current trend classification, momentum state with RSI value, and breakout status. All values are color-coded based on their bullish or bearish implications. The VWAP cell is color-coded green if price is above VWAP (bullish) and red if below (bearish), providing instant visual confirmation of price's position relative to this critical level.
Trade Levels Table
This table shows current signal status (LONG, SHORT, or WAIT), limit order distance in ATR units, calculated limit order price, stop-loss level, and target price with the reward-to-risk ratio displayed. The signal cell is highlighted in green for long signals and red for short signals.
ALERT CONDITIONS
The indicator includes four alert conditions that can be configured in TradingView:
1.
LONG Signal: Triggers when a long signal is generated, providing entry price, stop-loss, and target information.
2.
SHORT Signal: Triggers when a short signal is generated with corresponding trade details.
3.
Breakout Up: Notifies when price breaks out above resistance level.
4.
Breakout Down: Notifies when price breaks down below support level.
These alerts enable traders to receive notifications via TradingView's alert system without continuously monitoring the charts.
USAGE EXAMPLES AND TRADING SCENARIOS
Strong Bullish Trend with VWAP Support
In this scenario, price has been trading above the 9-period EMA for multiple bars, confirming a bullish trend. The current price is above VWAP, indicating buyers are willing to pay a premium. A recent swing low has established a support level, and RSI is reading 65, indicating building momentum without being overextended. When price breaks above the recent swing high resistance with a 2% tolerance, the indicator generates a long signal. The trader places a limit order below the current bar's close (0.5 ATR units) and sets the stop-loss 1.5 ATR units below the entry, with a target 2.0 times the stop distance away.
Short Setup During Volatile Session
During a particularly volatile NY session, price gaps down below VWAP early in the day. The 9-period EMA is declining, and both current and previous bars are below it, confirming a bearish trend. The RSI has dropped to 28, indicating strong bearish momentum. A recent swing high serves as resistance, and when price breaks below the swing low support level, the indicator generates a short signal. The trader enters on a limit order placed 0.5 ATR units above the current price, with the stop-loss 1.5 ATR units above the entry and the target at a 2.0 reward-to-risk ratio.
Avoiding Counter-Trend Trades
Consider a scenario where price is above VWAP and the RSI reads 72 (overbought), but the price is below the 9-period EMA and the previous bar was also below the EMA. In this case, the trend is classified as BEARISH (or SIDEWAYS) despite the bullish price position relative to VWAP. The indicator will not generate a long signal because the trend condition is not met, protecting the trader from what could be a bear trap or continuation pattern.
No Prior Levels Scenario
At the beginning of a trading session or after significant volatility has cleared prior swing points, there may be no established support or resistance levels in the lookback window. In this case, the breakout condition 'or na(resistanceLevel)' allows long signals to be generated without requiring a resistance level to be broken, enabling traders to participate in emerging trends without waiting for prior levels to form.
BEST PRACTICES AND TIPS
Timeframe Selection
This indicator is optimized for intraday timeframes (1-minute to 60-minute charts) and specifically for NY session trading. Higher timeframes may produce more reliable signals but fewer opportunities, while lower timeframes will generate more signals but with potentially lower reliability. Traders should backtest on their preferred timeframe before trading live.
Market Conditions
The indicator performs best in trending markets with clear directional bias. During ranging or sideways markets, the trend condition may oscillate frequently, and VWAP may oscillate around price, reducing signal quality. Consider filtering signals or reducing position size during low-volatility, range-bound conditions.
Parameter Optimization
While the default parameters have been selected for general applicability, traders should consider optimizing certain parameters for specific markets or instruments. For highly volatile instruments like crude oil or natural gas, increasing the 'atrMultiplier' to 2.0 or 2.5 may provide more appropriate risk management. For less volatile instruments like certain forex pairs, reducing the multiplier to 1.0 or 1.2 may improve signal quality.
Multiple Timeframe Analysis
For enhanced performance, traders can analyze the trend on a higher timeframe (such as 15-minute or hourly) while taking signals on a lower timeframe (such as 5-minute or 1-minute). This multi-timeframe approach ensures that signals are aligned with the larger trend direction.
Risk Management
While the indicator provides calculated stop-loss levels, traders should consider their overall position sizing and portfolio risk. The ATR-based stops provide a market-adaptive approach, but individual risk tolerance and account size should ultimately determine position sizing. The 2.0 reward-to-risk ratio is fixed but can be adjusted based on personal preferences or the specific characteristics of the instrument being traded.
INTEGRATION WITH TRADINGVIEW
Adding the Indicator
To add this indicator to a TradingView chart, paste the code into the Pine Script editor and click "Add to Chart." The indicator will appear in the chart's sidebar and begin calculating immediately once sufficient historical data is available.
Configuring Alerts
To set up alerts, right-click on any of the alert conditions in the indicator's settings panel (long signal, short signal, breakout up, or breakout down) and select "Add Alert." Configure the alert frequency and notification methods (push notification, email, webhook, etc.) according to your preferences.
Customization
All input parameters can be adjusted through the indicator's settings panel without modifying the source code. Traders can experiment with different VWAP sources, ATR lengths and multipliers, swing detection parameters, and table display options to suit their trading style and market preferences.
LIMITATIONS AND CONSIDERATIONS
Session Dependency
The indicator is specifically designed for NY session trading and will not generate signals outside these hours. Traders focused on other sessions or 24-hour markets may need to modify the session string to match their trading hours.
Historical Data Requirements
The indicator requires sufficient historical data to accurately calculate swing points and support/resistance levels. On lower timeframe charts with limited history, the initial signals may be less reliable until adequate swing points are identified.
Lag in Swing Detection
By definition, swing points are confirmed after the price has moved away from them, introducing some lag into support/resistance identification. Traders should be aware that the most recent swing point may not be confirmed until several bars after it occurs.
Not Financial Advice
This indicator is a technical analysis tool and should not be construed as financial advice. Traders are responsible for their own research and risk management decisions. Past performance of any trading system does not guarantee future results.
SUMMARY
The code follows a logical flow:
•
Version and Declaration: Pine Script version 6 indicator declaration with overlay enabled
•
Input Parameters: All user-configurable settings grouped by category
•
Session Logic: New York session tracking and open price recording
•
Core Calculations: VWAP, ATR, EMA, RSI, swing points
•
Support/Resistance Logic: Array-based storage and retrieval of swing levels
•
Trend and Momentum Classification: Categorization of current market state
•
Signal Generation: Confluence-based long and short conditions
•
Trade Level Calculations: Entry, stop-loss, and target pricing
•
Visual Plots: Hidden plots for alert data access
•
Information Tables: Real-time display of key values
•
Alert Conditions: Four configurable alert triggers
This structured approach ensures clarity, maintainability, and extensibility for future modifications or enhancements.

Adaptive MFT Extremum Pivots [Elysian_Mind]Adaptive MFT Extremum Pivots
Overview:
The Adaptive MFT Extremum Pivots indicator, developed by Elysian_Mind, is a powerful Pine Script tool that dynamically displays key market levels, including Monthly Highs/Lows, Weekly Extremums, Pivot Points, and dynamic Resistances/Supports. The term "dynamic" emphasizes the adaptive nature of the calculated levels, ensuring they reflect real-time market conditions. I thank Zandalin for the excellent table design.
---
Chart Explanation:
The table, a visual output of the script, is conveniently positioned in the bottom right corner of the screen, showcasing the indicator's dynamic results. The configuration block, elucidated in the documentation, empowers users to customize the display position. The default placement is at the bottom right, exemplified in the accompanying chart.
The deliberate design ensures that the table does not obscure the candlesticks, with traders commonly situating it outside the candle area. However, the flexibility exists to overlay the table onto the candles. Thanks to transparent cells, the underlying chart remains visible even with the table displayed atop.
In the initial column of the table, users will find labels for the monthly high and low, accompanied by their respective numerical values. The default precision for these values is set at #.###, yet this can be adjusted within the configuration block to suit markets with varying degrees of volatility.
Mirroring this layout, the last column of the table presents the weekly high and low data. This arrangement is part of the upper half of the table. Transitioning to the lower half, users encounter the resistance levels in the first column and the support levels in the last column.
At the center of the table, prominently displayed, is the monthly pivot point. For a comprehensive understanding of the calculations governing these values, users can refer to the documentation. Importantly, users retain the freedom to modify these mathematical calculations, with the table seamlessly updating to reflect any adjustments made.
Noteworthy is the table's persistence; it continues to display reliably even if users choose to customize the mathematical calculations, providing a consistent and adaptable tool for informed decision-making in trading.
This detailed breakdown offers traders a clear guide to interpreting the information presented by the table, ensuring optimal use and understanding of the Adaptive MFT Extremum Pivots indicator.
---
Usage:
Table Layout:
The table is a crucial component of this indicator, providing a structured representation of various market levels. Color-coded cells enhance readability, with blue indicating key levels and a semi-transparent background to maintain chart visibility.
1. Utilizing a Table for Enhanced Visibility:
In presenting this wealth of information, the indicator employs a table format beneath the chart. The use of a table is deliberate and offers several advantages:
2. Structured Organization:
The table organizes the diverse data into a structured format, enhancing clarity and making it easier for traders to locate specific information.
3. Concise Presentation:
A table allows for the concise presentation of multiple data points without cluttering the main chart. Traders can quickly reference key levels without distraction.
4. Dynamic Visibility:
As the market dynamically evolves, the table seamlessly updates in real-time, ensuring that the most relevant information is readily visible without obstructing the candlestick chart.
5. Color Coding for Readability:
Color-coded cells in the table not only add visual appeal but also serve a functional purpose by improving readability. Key levels are easily distinguishable, contributing to efficient analysis.
Data Values:
Numerical values for each level are displayed in their respective cells, with precision defined by the iPrecision configuration parameter.
Configuration:
// User configuration: You can modify this part without code understanding
// Table location configuration
// Position: Table
const string iPosition = position.bottom_right
// Width: Table borders
const int iBorderWidth = 1
// Color configuration
// Color: Borders
const color iBorderColor = color.new(color.white, 75)
// Color: Table background
const color iTableColor = color.new(#2B2A29, 25)
// Color: Title cell background
const color iTitleCellColor = color.new(#171F54, 0)
// Color: Characters
const color iCharColor = color.white
// Color: Data cell background
const color iDataCellColor = color.new(#25456E, 0)
// Precision: Numerical data
const int iPrecision = 3
// End of configuration
The code includes a configuration block where users can customize the following parameters:
Precision of Numerical Table Data (iPrecision):
// Precision: Numerical data
const int iPrecision = 3
This parameter (iPrecision) sets the precision of the numerical values displayed in the table. The default value is 3, displaying numbers in #.### format.
Position of the Table (iPosition):
// Position: Table
const string iPosition = position.bottom_right
This parameter (iPosition) sets the position of the table on the chart. The default is position.bottom_right.
Color preferences
Table borders (iBorderColor):
// Color: Borders
const color iBorderColor = color.new(color.white, 75)
This parameters (iBorderColor) sets the color of the borders everywhere within the window.
Table Background (iTableColor):
// Color: Table background
const color iTableColor = color.new(#2B2A29, 25)
This is the background color of the table. If you've got cells without custom background color, this color will be their background.
Title Cell Background (iTitleCellColor):
// Color: Title cell background
const color iTitleCellColor = color.new(#171F54, 0)
This is the background color the title cells. You can set the background of data cells and text color elsewhere.
Text (iCharColor):
// Color: Characters
const color iCharColor = color.white
This is the color of the text - titles and data - within the table window. If you change any of the background colors, you might want to change this parameter to ensure visibility.
Data Cell Background: (iDataCellColor):
// Color: Data cell background
const color iDataCellColor = color.new(#25456E, 0)
The data cells have a background color to differ from title cells. You can configure this is a different parameter (iDataColor). You might even set the same color for data as for the titles if you will.
---
Mathematical Background:
Monthly and Weekly Extremums:
The indicator calculates the High (H) and Low (L) of the previous month and week, ensuring accurate representation of these key levels.
Standard Monthly Pivot Point:
The standard pivot point is determined based on the previous month's data using the formula:
PivotPoint = (PrevMonthHigh + PrevMonthLow + Close ) / 3
Monthly Pivot Points (R1, R2, R3, S1, S2, S3):
Additional pivot points are calculated for Resistances (R) and Supports (S) using the monthly data:
R1 = 2 * PivotPoint - PrevMonthLow
S1 = 2 * PivotPoint - PrevMonthHigh
R2 = PivotPoint + (PrevMonthHigh - PrevMonthLow)
S2 = PivotPoint - (PrevMonthHigh - PrevMonthLow)
R3 = PrevMonthHigh + 2 * (PivotPoint - PrevMonthLow)
S3 = PrevMonthLow - 2 * (PrevMonthHigh - PivotPoint)
---
Code Explanation and Interpretation:
The table displayed beneath the chart provides the following information:
Monthly Extremums:
(H) High of the previous month
(L) Low of the previous month
// Function to get the high and low of the previous month
getPrevMonthHighLow() =>
var float prevMonthHigh = na
var float prevMonthLow = na
monthChanged = month(time) != month(time )
if (monthChanged)
prevMonthHigh := high
prevMonthLow := low
Weekly Extremums:
(H) High of the previous week
(L) Low of the previous week
// Function to get the high and low of the previous week
getPrevWeekHighLow() =>
var float prevWeekHigh = na
var float prevWeekLow = na
weekChanged = weekofyear(time) != weekofyear(time )
if (weekChanged)
prevWeekHigh := high
prevWeekLow := low
Monthly Pivots:
Pivot: Standard pivot point based on the previous month's data
// Function to calculate the standard pivot point based on the previous month's data
getStandardPivotPoint() =>
= getPrevMonthHighLow()
pivotPoint = (prevMonthHigh + prevMonthLow + close ) / 3
Resistances:
R3, R2, R1: Monthly resistance levels
// Function to calculate additional pivot points based on the monthly data
getMonthlyPivotPoints() =>
= getPrevMonthHighLow()
pivotPoint = (prevMonthHigh + prevMonthLow + close ) / 3
r1 = (2 * pivotPoint) - prevMonthLow
s1 = (2 * pivotPoint) - prevMonthHigh
r2 = pivotPoint + (prevMonthHigh - prevMonthLow)
s2 = pivotPoint - (prevMonthHigh - prevMonthLow)
r3 = prevMonthHigh + 2 * (pivotPoint - prevMonthLow)
s3 = prevMonthLow - 2 * (prevMonthHigh - pivotPoint)
Initializing and Populating the Table:
The myTable variable initializes the table with a blue background, and subsequent table.cell functions populate the table with headers and data.
// Initialize the table with adjusted bgcolor
var myTable = table.new(position = iPosition, columns = 5, rows = 10, bgcolor = color.new(color.blue, 90), border_width = 1, border_color = color.new(color.blue, 70))
Dynamic Data Population:
Data is dynamically populated in the table using the calculated values for Monthly Extremums, Weekly Extremums, Monthly Pivot Points, Resistances, and Supports.
// Add rows dynamically with data
= getPrevMonthHighLow()
= getPrevWeekHighLow()
= getMonthlyPivotPoints()
---
Conclusion:
The Adaptive MFT Extremum Pivots indicator offers traders a detailed and clear representation of critical market levels, empowering them to make informed decisions. However, users should carefully analyze the market and consider their individual risk tolerance before making any trading decisions. The indicator's disclaimer emphasizes that it is not investment advice, and the author and script provider are not responsible for any financial losses incurred.
---
Disclaimer:
This indicator is not investment advice. Trading decisions should be made based on a careful analysis of the market and individual risk tolerance. The author and script provider are not responsible for any financial losses incurred.
Kind regards,
Ely

[RickAtw] O1 Opening Market LineThis indicator helps to identify current support and resistance based on the opening of the Asian, London and New York sessions.
Function
You can make good trade entries based on these lines. Shows daily and weekly openings of each session
It will also help you to look at which session you are currently trading)
Purple ----> Asian session
Red ----> London session
Blue ----> New York session
Key Signal
buy ---> A strong buy signal is a bounce from the low and the presence of a weekly or day open line.
sell ---> A strong sell signal is a bounce from the maximum and the presence of a weekly or day open line.
P.S. Be sure to test on your pair!
Remarks
This will help you determine the approximate area of support and resistance.
Since we cannot look into the future, it does not inform you about the exact records, but a possible change in trends.
Readme
In real life, I am a professional investor. And I check each of my indicators on my portfolio and how effective it is. I will not post a non-working method. The main thing is to wait for the beginning of trends and make money!
I would be grateful if you subscribe ❤️

Machine Learning: Support and Resistance [YinYangAlgorithms]Overview:
Support and Resistance is normally based upon Pivot Points and Highest Highs and Lowest Lows. Many times coders even incorporate Volume, RSI and other factors into the equation. However there may be a downside to doing a pure technical approach based on historical levels. We live in a time where Machine Learning is becoming more and more used; thus we have decided to create a Machine Learning Support and Resistance Projection based Indicator. Rather than using traditional Support and Resistance calculations using historical data, we have taken a rather different approach. This Indicator instead attempts to Predict and Project where Support and Resistance locations will be based on a Machine Learning Model using a form of KNN (k-Nearest Neighbors).
Since this indicator creates a Projection of where it deems Support and Resistance will be, it has the ability to move its Support and Resistance before the price even gets to it if it believes it will surpass its projections. This may create a more accurate placement of Support and Resistance as they’re not based on historical levels.
This Indicator does not Repaint.
How it works:
This Indicator makes its projections based on the source you provide (by default close) of the previous bar and submits the source, RSI and EMA to our Projection Function to get its projection of the current bar.
The Projection function essentially calculates potential movement after finding the differences between the source the MA from the current bar, previous bar and average over the span of Machine Learning Length.
Potential movement is defined as:
Average Difference + Average(Machine Learning Average, Average Last Distance)
Average Difference: (Absolute value of Current Source - Current MA) - (Absolute value of Machine Learning Average - Machine Learning MA)
Average Last Distance: Average(Current Source - Current MA, Previous Source - Previous MA)
It then predicts the next bars directional movement (bullish or bearish bar) using several factors:
Previous Source > Previous MA
Current Source - Current MA > Average Source - Average MA
Current RSI > Previous RSI
Current RSI > 30 and Previous RSI <= 30
Current RSI < 70 and Previous RSI >= 70
This helps us to predict the direction the next bar may move.
We then calculate a multiplier that we apply to our Potential Movement value to get our final result which is our Current Bars Close Projection.
Our multiplier is calculated using:
(Current RSI > 30 and Previous RSI <= 30) OR (Current RSI < 70 and Previous RSI >= 70)
Current Source - Current MA > Previous Source - Previous MA
We then create an array and fill it with the previous X projections (Machine Learning Length) and send it to another function. This function, if told to, will sort the data accordingly and then output the KNN average of the length given.
We calculate and plot various KNN lengths to create different Zones:
Strong Support: Length of 2 but sort the data Ascending (low to high)
Strong Resistance: Length of 2 but sort the data Descending (high to low)
Support: Length of Machine Length Length / 10 or Min of 2 sorted by Ascending
Resistance: Length of Machine Length Length / 10 or Min of 2 sorted by Descending
There are also 4 other plots you may be wondering what they are, there is your AVG, VWMA, Long Term Memory and Current Projection.
By default your Current Projection is disabled in settings but you can enable it if you are curious to see how the projections for each close are calculated. It is, however, not a crucial point of interest (white line).
The average is simply the average value of the Machine Learning Data (purple line).
The VWMA is a VWMA calculation applied to our Data over a length specified in settings (by default 1)(blue line). The VWMA is crucial when combined with the Avg as they can cross over and under each other. These crosses represent potential Bullish and Bearish zones.
Lastly, but certainly not least, we have the Long Term Memory (maroon line). The Long Term Memory can be displayed either as an ‘Average’, ‘Hard Line’ or ‘None’. The Long Term Average is only updated every Machine Learning Length Bar Index’s and is populated with the average of the Machine Learning Data. For Instance, if Machine Learning Length is set to 100, the Long Term Memory is only updated every 100 bars, and since its length is the same as the Machine Learning Length, that means its data is composed of 10,000 bars worth of data. The Long Term Memory may be very beneficial for determining where Support and Resistance lie over the Long Term within a Machine Learning Algorithm. When set to ‘Average’ it plots the connection lines diagonally, and although they may be more visually appealing, they’re less useful when it comes to actually seeing support and resistance as generally speaking, support and resistance lie on the horizontal. When set to ‘Hard Line’ the Long Term Memory is connected with hard lines and holds the price value until the next time it is updated. This makes it much more useful for potentially identifying Support and Resistance.
Tutorial:
Here is an overview of what the Indicator looks like, now let's start to dissect it.
In the example above we can see how all of the lines between the Major Support and Resistance zones may act as BOTH Support and Resistance depending on which side the price is currently on. In the circle on the left, we can see how it can fluctuate between the two. If you look at the circle on the right, we can see how the Average line acts as a strong support before it fails to maintain it. Generally speaking, most Support and Resistance locations may potentially fail to hold after 3 tests, as the Average did in this example.
As you can see, the Support and Resistance doesn’t wait to be tested before adjusting, which is why there are 2 lines which create their zones. The inner line is the Support/Resistance and the outer line is the Strong Support/Resistance. The Yellow Circle shows the inner line was able to calculate the moving resistance correctly and then adjusted accordingly as it was projecting the price to keep increasing. However, if you look at the White Circle, you can see that since there was first a crash, and then parabolic movement, that the inner zone could not move and predict the resistance as well as the outer zone could.
We consider the price to be ‘Overvalued’ when it is above the VWMA (blue line) and ‘Undervalued’ when it is below the VWMA. It is considered ‘fair’ price when it is within the VWMA to Average zone (between the blue and purple lines). If you look at the example above, you’ll notice where the two yellow circles are, it is not only considered ‘Overvalued’, but it then proceeds to ride the inner resistance line upwards. This is common when the market is overly bullish and vice versa when it is bearish. Please keep in mind, although it is common, it doesn’t mean a correction can’t happen.
In this example above we look at the last bull run that may have started due to the halving. This bull run was very bullish as you can see in the example above. The price was constantly sitting within the Resistance Zone and the VWMA that was very close to it was constantly acting as a Support. Naturally, due to the Algorithm used in this Indicator, as the momentum starts to slow down, the VWMA (blue line) will start to space out more and more from the Resistance Zone. This doesn’t mean the momentum is gone, it just means it may be slowing down.
Unfortunately we have to study the Bear Market with a different perspective than the Bull Market. However, there are still some similarities within the two. If you refer to the example above and the previous example, you can clearly see that the Bull Market loves to stay with the Resistance Zone and use the VWMA as a Support. However, the Bear Market does not. This is a normal occurrence, however we can see from the example above you may see a correction / horizontal movement when the Outer Support Line is touched. If you look at all 3 yellow circles, the Outer Support Line was touched, then either a small correction or horizontal consolidation occurred.
We will conclude our Tutorial here, hopefully you’ll be able to benefit from a moving Support and Resistance calculated with Machine Learning that projects its locations, rather than using traditional calculations.
Settings:
Source: This source is the base for all our calculations
Machine Learning Length: How much projection data are we storing and using to make calculations.
Smoothing Length: We need to smooth calculations such as RSI, EMA and VWMA. What length are we smoothing it with?
VWMA ML Projection Length: How far into our Machine Learning data should we average for our VWMA. Please note the 'Smoothing Length' is still applied here after getting the Projection Average.
Long Term Memory: Long term memory has the same storage length but is only updated once per Machine Learning Length. For instance, if Machine Learning Length is 100, it will save the Average of our data once every 100 bars. This means its memory is an average of 10,000 bars of Machine Learning. 'Average' connects its values diagonally whereas 'Hard Line' holds its value until it changes.
Use Average Last Distance In Potential Movement: This can help accuracy but generally also displaces the Support and Resistance by projecting it further.
Show Current Projection: Projections occur for each bar, and our Machine Learning utilizes these projections by storing and evaluating them. This toggle will display the Current Projection Line which is used to create all our Projections.
If you have any questions, comments, ideas or concerns please don't hesitate to contact us.
HAPPY TRADING!
